|
|
|
|||
        |
|
|
|
[an error occurred while processing this directive]
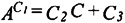
5.4.2 Example 1 — Polymer Required for Dewatering Versus ConcentrationThe U.S. Bureau of Mines investigated a method of dewatering flocculated fine-particle waste that involves flocculating clay with a high-molecular-weight polymer such as polyethylene oxide (PEO). Stanley and Scheiner (1985) found an empirical relationship between the amount of polymer required for dewatering clay and the polymer concentration. The equation is of the form
where
This problem is difficult to solve using a traditional least-squares approach. Thus, to establish the correlation, A is raised to the C1 power and plotted versus C. This method is illustrated for an unexchanged attapulgite clay dewatered with 0.05 pct PEO solution. The data points are plotted for values of C1 of 1.7, 2.1, and 2.5 as shown in Figure 5.3. A unique straight line is obtained at 2.1. This selection method is a trial-and-error process. The use of a GA in fitting data to an equation of the given form shows its effectiveness in solving non-linear curve-fitting problems.
The addition of a third constant makes this example more difficult than the line represented by data points considered in the previous section because the size of the search space has increased significantly (from 222 to 233 possible solutions). Parameter sets are coded in the same manner as those of the line, except the strings representing the parameters now have a length of 33; the first 11 bits represent C1, the second 11 bits represent C2, and the final 11 bits represent C3. The constants are once again determined based on the minimization of the square of the distance between the points and the curve. C1, C2, and C3 were considered to range from -32.0 to 32.0. Three data points were fitted for both aluminum-exchanged and potassium-exchanged clays. Figure 5.4 shows the best-of-generation error for two independent runs as it decreases with successive generations. Again the results of the GA quickly converge to near-optimal solutions. The results produced by the GA are compared with those of Stanley and Scheiner’s (1985) trial-and-error method in Figure 5.5. The constants produced by the GA are compared with those of Stanley and Scheiner in Table 5.7.
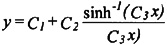
5.4.4 Example 2 — Ree-Eyring EquationThe Ree-Eyring equation allows for the estimation of the Newtonian and non-Newtonian components of viscosity and is of interest to the mineral processing industry. The Ree-Eyring equation can be written as
where
The process of fitting the data using a GA is the same as in the previous example. The parameter set (C1, C2, and C3) is again represented as a 33-bit string of zeros and ones and is determined by minimizing the square of the distance between the data points and the curve. Since this equation cannot be fitted to data using a direct least-squares approach, Stanley, Webb, and Scheiner (1986) used a transformation method to solve the Ree-Eyring equation for a sodium ion-exchanged clay. The data used in that report were also used here, and the results of the curve produced using the GA are compared with those previously obtained. Once again the GA quickly converged an excellent solution. Figure 5.6 shows the best-of-generation error for two independent runs as it decreases with successive generations. The smallest error produced by the GA calculated curve (1.57) is less than that of the curve calculated by the transformation method used by Stanley, Webb, and Scheiner (12.55). Figure 5.7 shows how well the curve calculated by the GA (C1=168.83, C2=34.20, and C3=0.043) fits the data. C1, C2, and C3 ranged between -200.0 and 200.0.
Copyright © CRC Press LLC
|
 |
         |
|
)
)
)
)
)
)