|
|
|
|||
        |
|
|
|
[an error occurred while processing this directive]
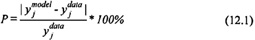
This rule describes a relationship between the input and output parameters using linguistic terms like “small”, “medium”, “large”, and “fast” to represent the input parameters and numeric values to represent the output values. The linguistic terms are conceptually easy for humans to comprehend. But, these terms are actually subjective linguistic terms — they can mean slightly different things to different human “experts.” Such subjective concepts are not readily manipulated by computers, and therefore must be defined using fuzzy membership functions. As with the fuzzy control systems described in Part 1 of this book, the membership functions and the rules must be chosen carefully. The genetic algorithm has been used to expedite the process of rule selection and membership function tuning. The coding and fitness function definitions are straightforward and virtually identical to those set forth in previous chapters. A self-generating fuzzy linguistic modeling system has been developed that employs a genetic algorithm to select membership functions and to define rule sets. The system is capable of predicting the performance of nonlinear processes and mechanisms by considering only a data set that contains the input/output relationships. Accurate fuzzy linguistic models of both a grinding circuit and a flotation circuit have been generated that provide some insights into the relationships between the various parameters. Figures 12.3 and 12.4 demonstrate the results of using the fuzzy computer model to predict the fineness associated with data for a training set; a set of data used explicitly by the genetic algorithm to train the model. Figure 12.3 compares the value of fineness predicted by the computer model with the value of fineness of the actual grinding circuit. Note that a “perfect” computer model would elicit points along the 45° line. This “45°” figure provides insight into the accuracy of the computer model. However, it is occasionally difficult to judge the quality of the computer model by considering this plot alone. Figure 12.4 is a histogram that provides an alternative viewpoint on the accuracy of the computer model. This figure gives an indication of the number of points within a certain percent error. Here, percent error (P) is defined according to the following formula:
where yj again denotes one of the four output variables (in this instance it is the fineness). Finally, a correlation coefficient has been calculated to further indicate the effectiveness of the computer model. The correlation coefficient for fineness associated with the training set is 0.9599.
The fuzzy computer model accurately estimates the fineness associated with the training data. However, the real test of the model’s effectiveness lies with its ability to compute the value of fineness for a test set containing data the model has never been exposed to. Thus, Figures 12.5 and 12.6 are a “5°” and “histogram” for a test set of data. This test set is composed of data from a grinding circuit and differs from the training set only in that the fuzzy model was not trained on the same data. As with the training set, the fuzzy model is able to accurately compute fineness. A correlation coefficient of 0.9811 was obtained.
The results of the model’s ability to estimate fineness as characterized by Figures 12.3 through 12.6 are indicative of its performance in predicting the other three measures of grinding performance. Therefore, for the other three performance measures, (1) energy costs associated with the process, (2) distribution modulus that is the packing density at minimal viscosity, and (3) the apparent viscosity of the ground product, the training cases are not considered. Figures 12.7 through 12.12 show the performance of the model on only the test cases. Additionally, Table 12.1 shows appropriate correlation coefficients.
Copyright © CRC Press LLC
|
 |
         |
|
)
)
)
)
)
)
)
)
)
)